2025 · Flutter Entertainment / PokerStars · In Progress
Data Dashboard
Product Initiative · Cross-functional · In Progress
Introduction
The Casino Behavioural Dashboard is an internal analytics tool built on Databricks, designed to give PokerStars product, CRM, and analytics teams a unified view of player behaviour across sessions, game engagement, lobby interactions, and player demographics.
Before this project, teams were working from fragmented data exports and ad-hoc queries. My role was to design the information architecture and interface across all 8 dashboard pages.
2.29M
Sessions captured
659K
Unique users
8
Dashboard pages
Casino Behavioural Dashboard — designed in Databricks to unify player behaviour data for PokerStars product, CRM, and analytics teams
Goals
Create a single source of truth for casino player behaviour, accessible to non-technical stakeholders.
Structure data into four coherent modules: Session & Engagement, Lobby Widgets, Games Engagement, Player Information.
Design global filters (time frame, license, platform, login state) that apply across all pages consistently.
Make the dashboard scalable — new data sources should slot in without a redesign.
Discovery — Information Architecture
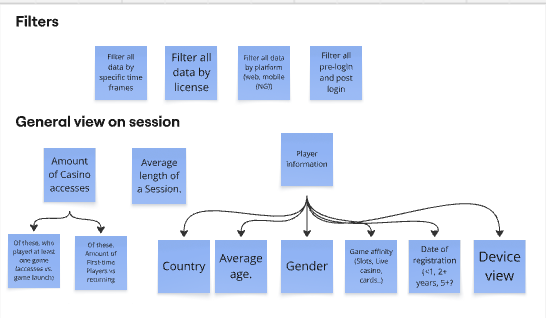
The discovery phase was a series of workshops with analytics, product, and CRM stakeholders. Rather than asking "what data do you want?", I asked "what decisions do you need to make?" — which produced a tighter, more actionable set of requirements.
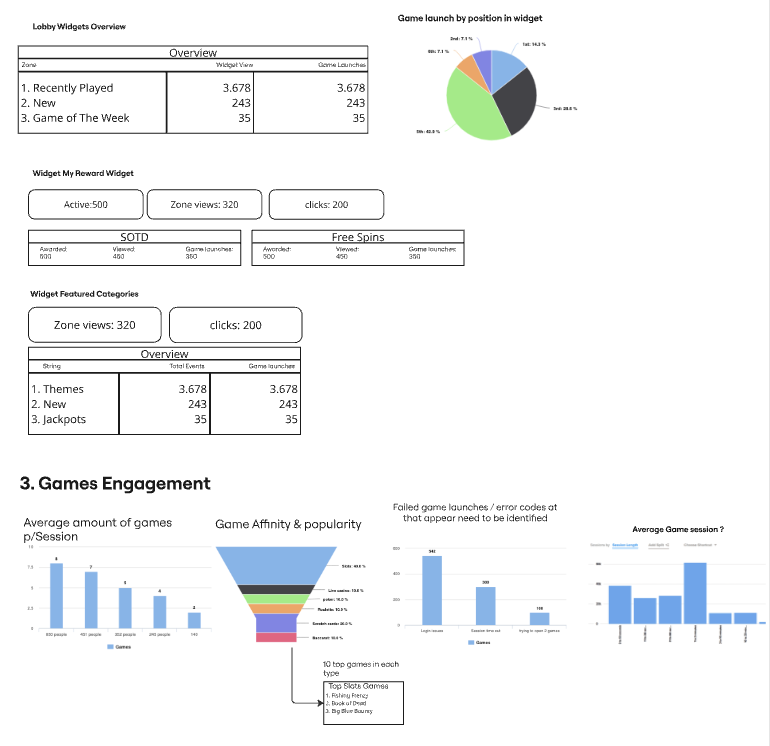
Session IA — global filter dimensions (time, license, platform, login state) and session-level metric requirements
The dashboard is structured around four core sections:
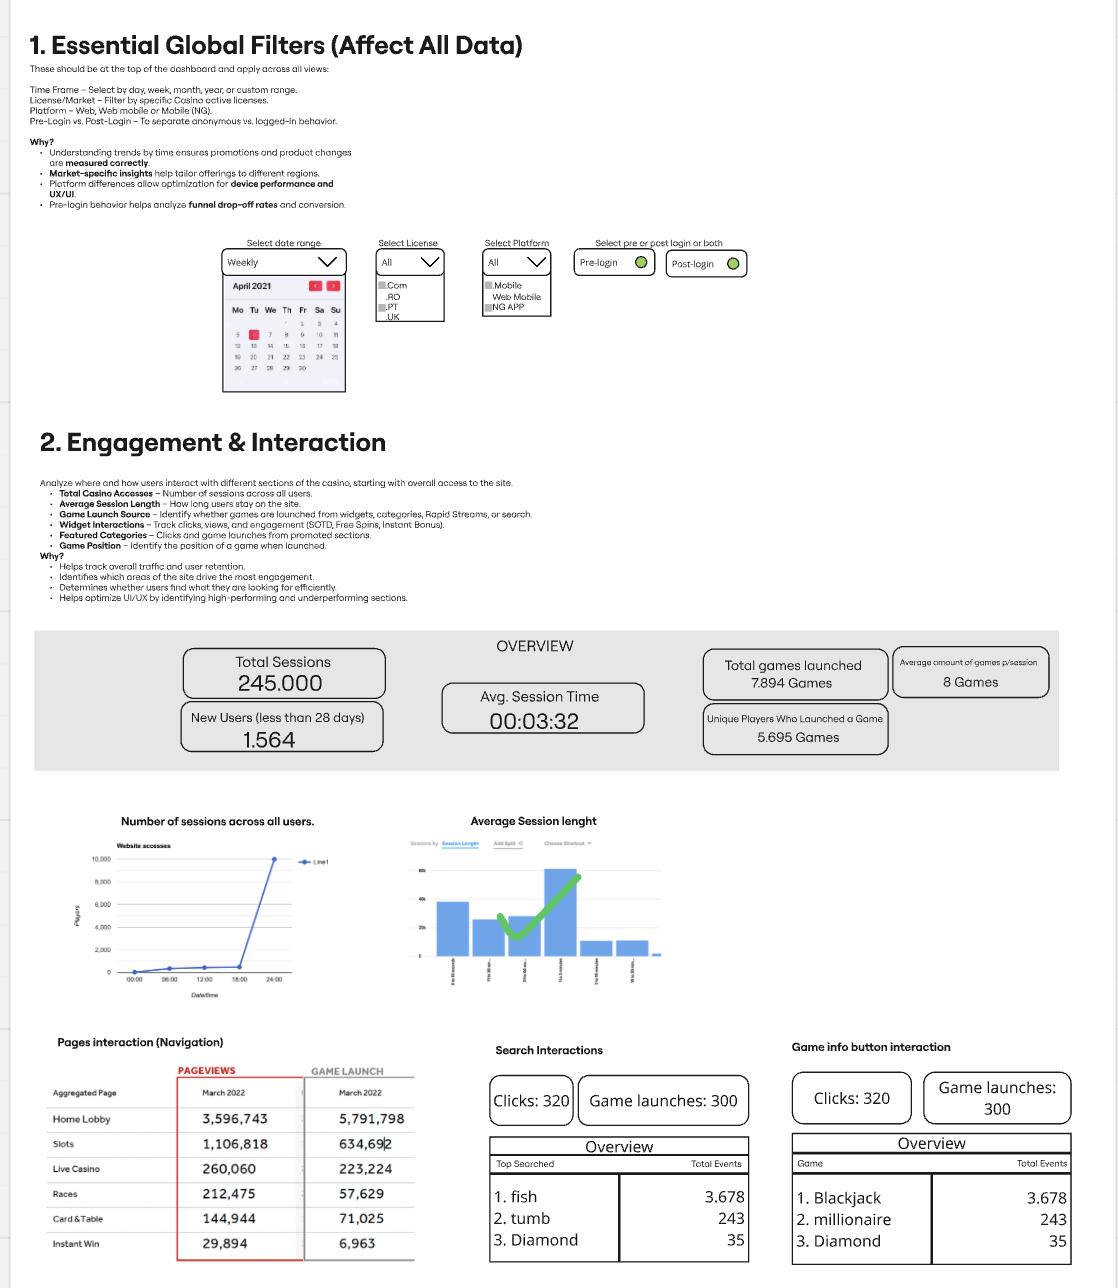
Essential Global Filters — time frame, license, platform, login state. Applied to all pages.
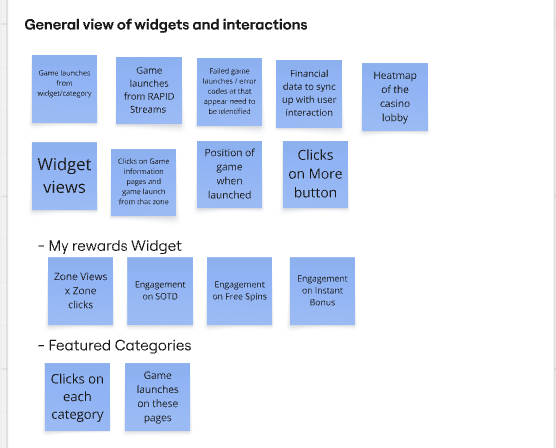
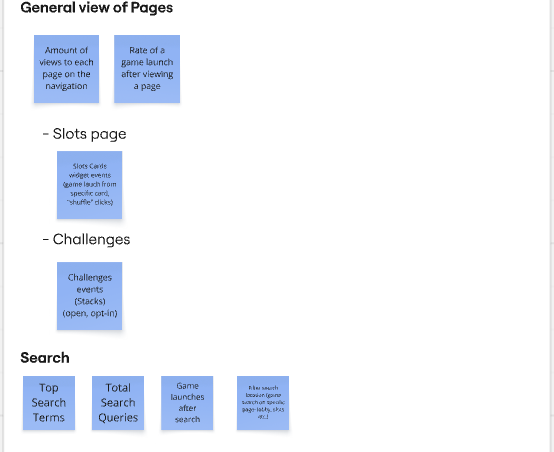
Engagement & Interaction — total sessions, avg session time, game launches, page navigation, lobby widget performance.
Games Engagement — game affinity funnel, failed launch tracking, avg game session.
Player Information — player type, country, age/gender distribution, device used.
Section 1 & 2 — Global Filters and Engagement overview (245,000 total sessions, avg 00:03:32)Lobby Widgets breakdown — My Rewards Widget (Active: 500, Zone views: 320, Clicks: 200) and Games Engagement funnel
Final Dashboard
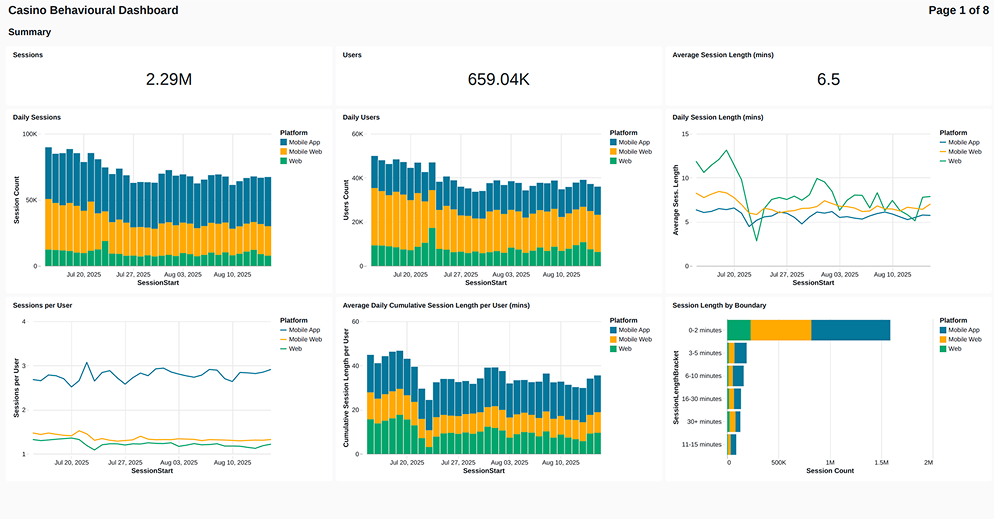
The production dashboard runs in Databricks. Below are screenshots of the implemented design showing the Summary page (Page 1 of 8) with live data.
Summary — Page 1 of 8. 2.29M sessions, 659.04K users, 6.5 min avg session, broken down by platform
Outcome
Design is complete for all 8 pages. The first two modules are live in Databricks; remaining modules are in the engineering backlog for H2 2025. Stakeholder feedback has been positive — the global filter pattern is already being requested for other internal tools.
Conclusion
Internal tooling is chronically under-designed. This project was an exercise in applying the same rigour to a non-customer-facing product that you'd bring to a consumer interface.
Asking "what decision does this enable?" rather than "what data should we show?" was the single most valuable question of the project.